GSLB with EC2
08 May 2010(originally posted on Bizo's dev blog here)
This is an unofficial continuation of Amazon's blog post on the use of Amazon CloudFront to improve application performance.
CloudFront is a great CDN to consider, especially if you're already an Amazon Web Services customer. Unfortunately, it can only be used for static content; the loading of dynamic content will still be slower for far-away users than for nearby ones. Simply put, users in India will still see a half-second delay when loading the dynamic portions of your US-based website. And a half-second delay has a measurable impact on revenue.
Let's talk about speeding up dynamic content, globally.
The typical EC2 implementation comprises instances deployed in a single region. Such a deployment may span several availability zones for redundancy, but all instances are in roughly the same place, geographically.
This is fine for EC2-hosted apps with nominal revenue or a highly localized user base. But what if your users are spread around the globe? The problem can't be solved by moving your application to another region - that would simply shift the extra latency to another group.
For a distributed audience, you need a distributed infrastructure. But you can't simply launch servers around the world and expect traffic to reach them. Enter Global Server Load Balancing (GSLB).
A primer on GSLB
Broadly, GSLB is used to intelligently distribute traffic across multiple datacenters based on some set of rules.
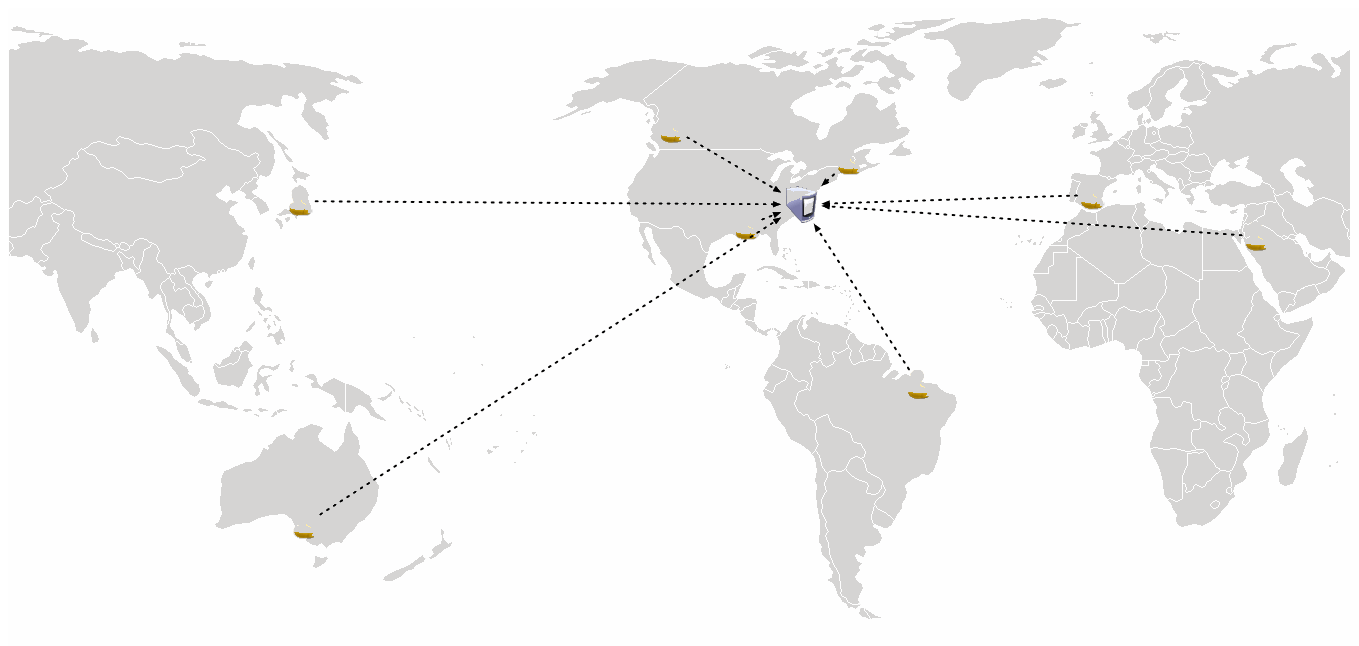
With GSLB, your traffic distribution can go from this:
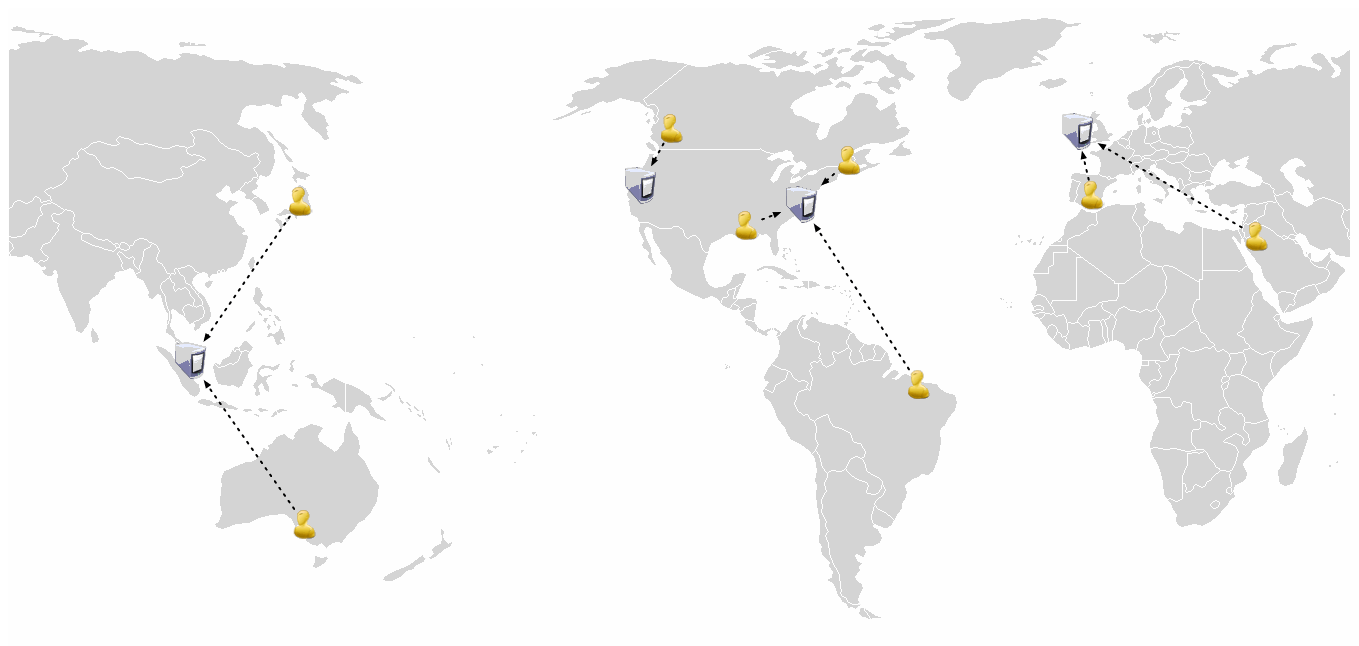
To this:
GSLB can be implemented as a feature of a physical device (including certain high-end load balancers) or as a part of a DNS service. Since we EC2 users are clearly not interested in hardware, our focus is on the latter: DNS-based GSLB.
Standard DNS behavior is for an authoritative nameserver to, given queries for a certain record, always return the same result. A DNS-based implementation of GSLB would alter this behavior so that queries return context-dependent results.
Example:
User A queries DNS for gslb.example.com -- response: 10.1.0.1
User B queries DNS for gslb.example.com -- response: 10.2.0.1
But what context should we use? Since our goal is to reduce wire latency, we should route users to the closest datacenter. IP blocks can be mapped geographically -- by examining a requestor's IP address, a GSLB service can return a geo-targeted response.
With geo-targeted DNS, our example would be:
User A (in China) queries DNS for geo.example.com -- response: 10.1.0.1
User B (in Spain) queries DNS for geo.example.com -- response: 10.2.0.1
Getting started
At a high level, implementation can be broken down into two steps: 1. Deploy infrastructure in other AWS regions 2. Configure GSLB-capable DNS
Infrastructure configurations will vary from shop to shop, but as an example, a read-heavy EC2 application with a single master database for writes should: - deploy application servers to all regions - deploy read-only (slave) database servers and/or read caches to all regions - configure application servers to use the slave database servers and/or read caches in their region for reads - configure application servers to use the single master in the "main" region for writes
This is what such an environment would look like:
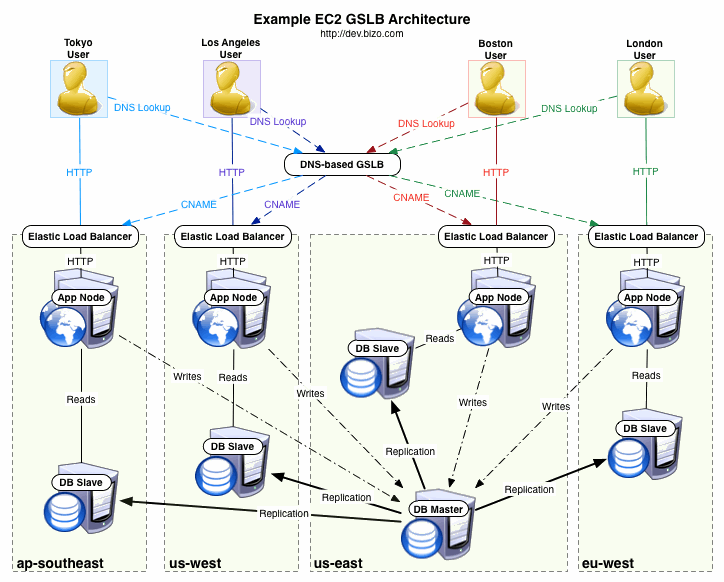
When configuring servers to communicate across regions (app servers -> master DB; slave DBs -> master DB), you will need to use IP-based rules for your security groups; traffic from the "app-servers" security group you set up in eu-west-1 is indistinguishable from other traffic to your DB server in us-east-1. This is because cross-region communication is done using external IP addresses. Your best bet is to either automate security group updates or use Elastic IPs.
Note on more complex configurations: distributed backends are hard (see Brewer's [CAP] theorem). Multi-region EC2 environments are much easier to implement if your application tolerates the use of 1) regional caches for reads; 2) centralized writes. If you have a choice, stick with the simpler route.
As for configuring DNS, several companies have DNS-based GSLB service offerings: - Dynect - Traffic Management (A records only) and CDN Manager (CNAMEs allowed) - Akamai - Global Traffic Management - UltraDNS - Directional DNS - Comwired/DNS.com - Location Geo-Targeting
DNS configuration should be pretty similar for the vendors listed above. Basic steps are: 1. set up regional CNAMEs (us-east-1.example.com, us-west-1.example.com, eu-west-1.example.com, ap-southeast-1.example.com) 2. set up a GSLB-enabled "master" CNAME (www.example.com) 3. define the GSLB rules: - For users in Asia, return ap-southeast-1.example.com - For users in Europe, return eu-west-1.example.com - For users in Western US, return us-west-1.example.com - ... - For all other users, return us-east-1.example.com
If your application is already live, consider abstracting the DNS records by one layer: geo.example.com (master record); us-east-1.geo.example.com, us-west-1.geo.example.com, etc. (regional records). Bring the new configuration live by pointing www.example.com (CNAME) to geo.example.com.
Bizo's experiences
Several of our EC2 applications serve embedded content for customer websites, so it's critical we minimize load times. Here's the difference we saw on one app after expanding into new regions (from us-east-1 to us-east-1, us-west-1, and eu-west-1) and implementing GSLB (load times provided by BrowserMob):
Load times before GSLB:
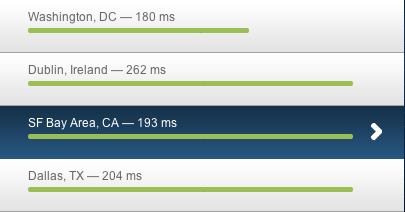
Load times after GSLB:
Reduced load times for everyone far from us-east-1. Users are happy, customers are happy, we're happy. Overall, a success.
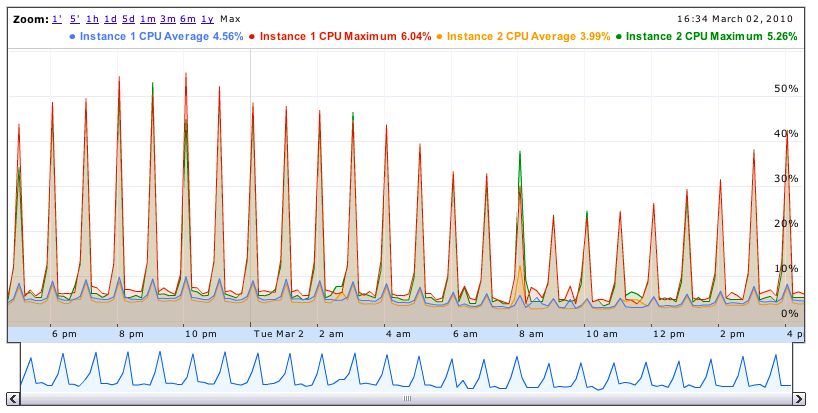
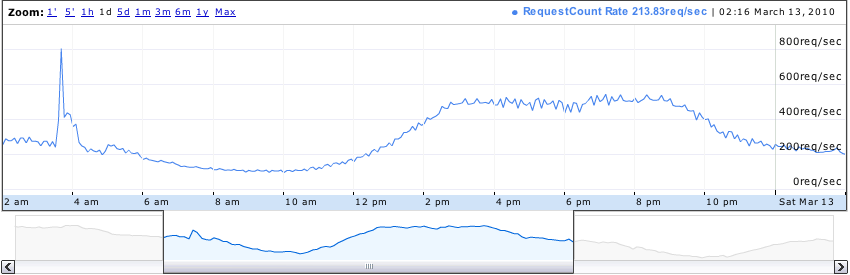
It's interesting to see how the load is distributed throughout the day. Here's one application's HTTP traffic, broken down by region (ELB stats graphed by cloudviz):
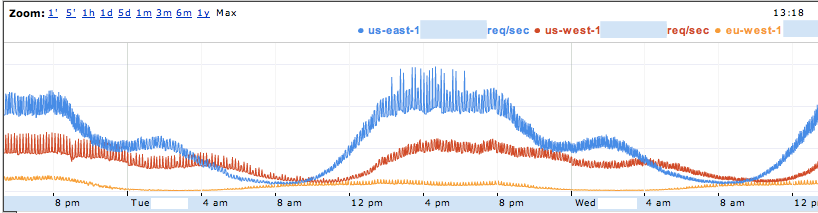
Note that the use of Elastic Load Balancers and Auto Scaling becomes much more compelling with GSLB. By geographically partitioning users, peak hours are much more localized. This results in a wider difference between peak and trough demand per region; Auto Scaling adjusts capacity transparently, reducing the marginal cost of expanding your infrastructure to multiple AWS regions.
For our GSLB DNS service, we use Dynect and couldn't be more pleased. Intuitive management interface, responsive and helpful support, friendly, no-BS sales. Pricing is based on number of GSLB-enabled domains and DNS query rate. Contact Dynect sales if you want specifics (we work with Josh Delisle and Kyle York - great guys). Note that those intending to use GSLB with Elastic Load Balancers will need the CDN Management service.
Closing remarks
Previously, operating a global infrastructure required significant overhead. This is where AWS really shines. Amazon now has four regions spread across three continents, and there's minimal overhead to distribute your platform across all of them. You just need to add a layer to route users to the closest one.
The use of Amazon CloudFront in conjunction with a global EC2 infrastructure is a killer combo for improving application performance. And with Amazon continually expanding with new AWS regions, it's only going to get better.