Introducing Cloudviz
17 Mar 2010(originally posted on Bizo's dev blog here)
Amazon CloudWatch exposes a variety of useful metrics for EC2 instances, Elastic Load Balancers, and more. Unfortunately, it is tedious to query directly and the results can be difficult to interpret.
Like most operational metrics, CloudWatch data provides the most insight when graphed. While there are existing tools to graph CloudWatch data, they are only available as part of a proprietary suite or service and, generally, they sacrifice customization and flexibility for ease-of-use.
Here at Bizo, we wanted to incorporate CloudWatch data into operational dashboards. Nothing we found was flexible enough to meet our needs, so we decided to write our own. We are now releasing it to for all to use.
I'm pleased to introduce cloudviz, an open source tool for creating embeddable CloudWatch graphs.
Specifically, cloudviz is a data source that exposes CloudWatch data for graphing by Google Chart Tools. It's written in Python using Google's Data Source library and Mitch Garnaat's excellent AWS interface, boto.
With cloudviz, it's easy to create graphs like these:
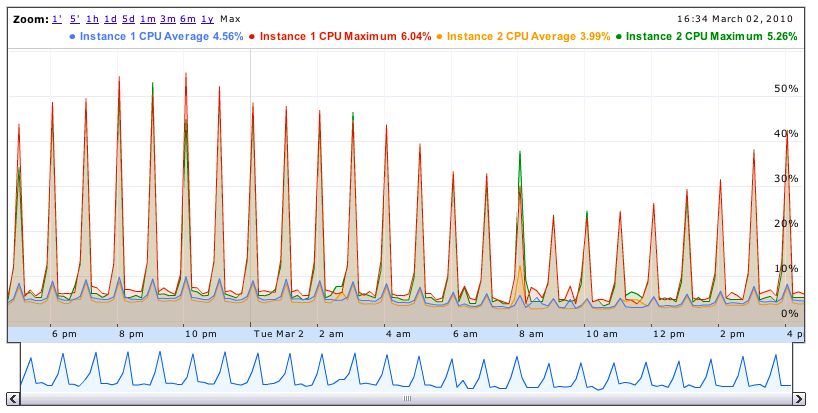
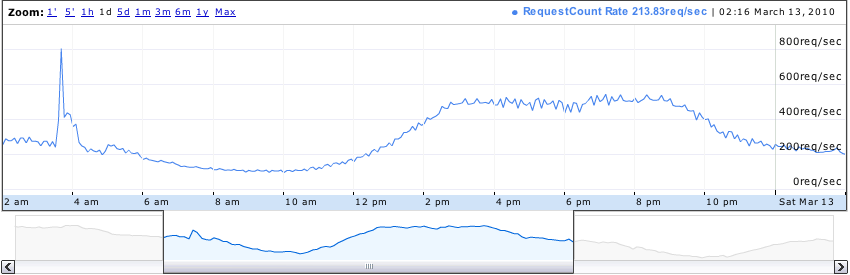
I encourage you to check out the project on GitHub here. There's a fairly detailed README and plenty of examples, but feel free to drop me a line if you have any questions, michael.babineau@gmail.com.
Happy graphing!